Statistical Sampling and Inference
Summary:
The PDF document “EIST1M1-Notes Statistical Sampling and Inference” is a comprehensive guide on statistical concepts and methods. It is divided into two main chapters, each covering various subtopics. Below is a summary of the key points:
Chapter 1: Sampling Distributions
- Definitions: Introduces the concept of sampling distributions, which arise when repeated samples are drawn from a population and a statistic is calculated for each sample.
- Central Limit Theorem: Explains that for sufficiently large sample sizes, the sample mean is approximately normally distributed.
- T-distribution: Describes the Student’s t-distribution, which is used when the sample size is small and the population is approximately normal.
-
Chi-square Distribution: Discusses the chi-square distribution, which arises in various sampling situations, like comparing sequences of observed and expected frequencies.
- F-distribution: Explains the F-distribution, which compares variances of two normally distributed populations.
Chapter 2: Statistical Inference: Estimation for One Sample Case
- Statistical Inference: Refers to the methodology used to conclude population parameters based on samples.
- Point and Interval Estimation: Defines a point estimate and an interval estimate.
- Confidence Intervals: Introduces the terminology related to confidence intervals, including lower and upper confidence limits.
The document also includes tables for t-distribution, chi-square distribution, and F-distribution, as well as examples to illustrate the concepts.
Excerpt:
Statistical Sampling and Inference
Chapter 1 – Sampling distributions
1.1 Definitions
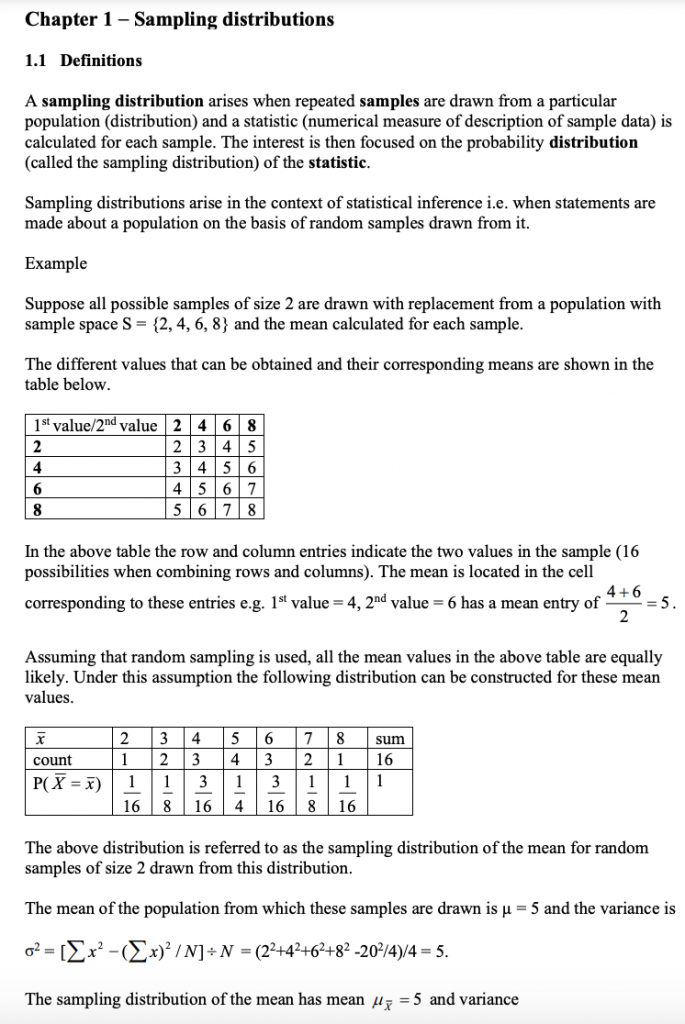
A sampling distribution arises when repeated samples are drawn from a particular population (distribution), and a statistic (numerical measure of description of sample data) is calculated for each sample. The interest is then focused on the statistic’s probability distribution (called the sampling distribution).
Sampling distributions arise in the context of statistical inference, i.e. when statements are made about a population based on random samples drawn from it.
Example:
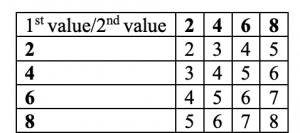
Suppose all possible samples of size two are drawn with replacement from a population with sample space S = {2, 4, 6, 8} and the mean calculated for each sample.
The different values that can be obtained and their corresponding means are shown in the
table below:

Statistical Sampling and Inference
In the above table, the row and column entries indicate the two values in the sample (16 possibilities when combining rows and columns).


Reviews