
Descriptive Statistics Explained
Summary:
Descriptive statistics involves summarizing and analyzing data to derive meaningful information. Raw data, which refers to unsummarized and unorganized data, can be categorized as numerical or categorical. To organize qualitative data, frequency distribution tables are constructed, which display the categories, scores, frequencies, relative frequencies, and percentages. Graphical representations such as bar and pie charts are commonly used to visually present qualitative data. On the other hand, quantitative data can be organized using frequency distribution tables, with measures like range, interval width, class midpoints, and cumulative frequencies. Histograms, frequency polygons, and cumulative frequency polygons are effective graphical methods for displaying quantitative data. Measures of location, such as the mean, mode, and median, provide insights into the centre of a data set. For grouped data, the mean and mode can be calculated using class midpoints and frequencies. Quantiles, including quartiles, deciles, and percentiles, divide data into equal parts and can be determined using cumulative frequencies and interpolation. Descriptive statistics provide a comprehensive framework for understanding and summarizing data, allowing researchers and analysts to extract valuable insights and make informed decisions based on the information.
Excerpt:
Descriptive Statistics Explained
1.1 INTRODUCTION
The purpose of statistics is to gather information about data. Data sets are often so large that it is
impossible to make sense of it, and therefore it must be summarized.
Descriptive statistics comprises those methods concerned with collecting and describing a set of
data to yield meaningful information.
1.2 RAW DATA
Data that are not summarized or arranged in any way are called raw data.
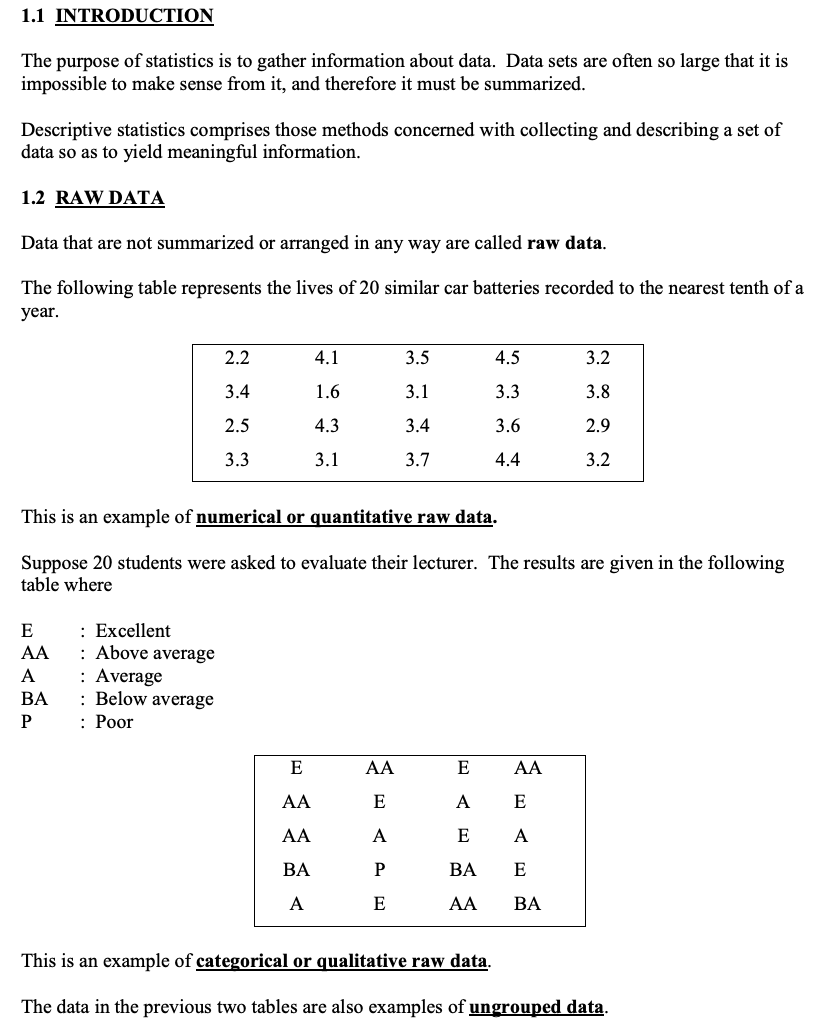
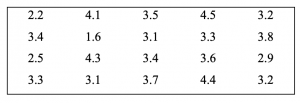
The following table represents the lives of 20 similar car batteries recorded to the nearest tenth of a
year.
Descriptive Statistics
This is an example of numerical or quantitative raw data.
Suppose 20 students were asked to evaluate their lecturer. The results are given in the following
table where
E: Excellent
AA: Above average
A: Average
BA: Below average
P: Poor
Reviews