Building and Interpreting Histogram
Summary:
A histogram is a graph used to visualize numerical (quantitative) variables and understand their distribution. It provides insights into the frequency of values within specific intervals or classes. The height of the columns in a histogram represents the frequency, while the width represents the class intervals. By constructing a histogram, we can identify the most frequent values, observe patterns, and understand the overall data distribution.
Building a histogram involves several steps. Firstly, we determine the number of classes, which can be based on the square root of the total number of observations. Next, we calculate the class width by dividing the range of values by the number of classes, rounding up for a more balanced representation. Class limits are established by selecting starting points and adding the class width consecutively. Class boundaries and midpoints are also determined for more precise analysis.
Interpreting a histogram entails examining its shape, centre, and spread, and identifying unusual observations or outliers. The shape of a histogram provides valuable information about the distribution, such as whether it is skewed to the left or right, symmetric, bimodal, or uniform. The centre can be estimated by finding the midpoint of the most frequent class. The spread refers to the range of values encompassed by the data, which can be assessed by considering the width of the histogram. Unusual observations or outliers are notable data points that deviate significantly from the overall pattern.
In addition, a histogram can be used to estimate measures like the mean and standard deviation. We can estimate the mean by calculating the weighted average of the class midpoints using the frequencies. The standard deviation can also be approximated using appropriate formulas.
Excerpt:
Building and Interpreting Histogram
Histogram
● It is a graph for numerical (quantitative) variables.
● It allows us to see which values are most frequent, which are rarer and where the numbers typically are.
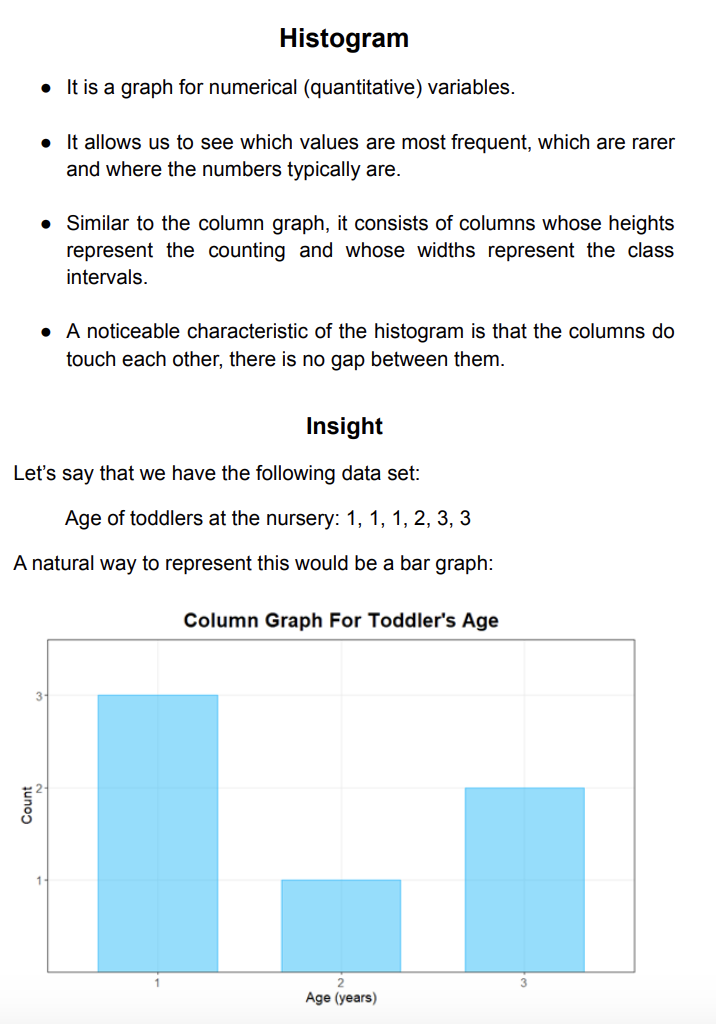
● Similar to the column graph, it consists of columns whose heights represent the counting and widths represent the class intervals.
● A noticeable characteristic of the histogram is that the columns touch each other. There is no gap between them.


Reviews